The British Pound to US Dollar exchange rate (GBP/USD) is at a critical juncture. Let’s break down the current situation and what it could mean for traders in the near future.

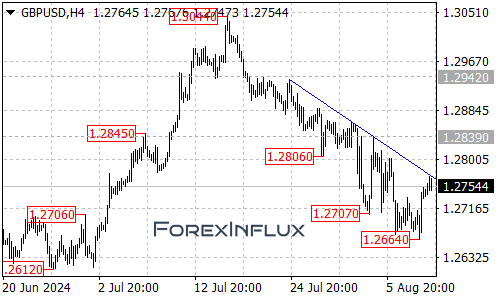
Current Situation GBP/USD is currently testing a key resistance level – the falling trend line on the 4-hour chart. This moment could determine the pair’s direction in the coming days or weeks.
Potential Bullish Scenario If GBP/USD breaks above the trend line resistance, it could signal a significant shift in momentum. Here’s what to watch for:
- Trend Line Break: A move above the falling trend line would suggest that the recent downtrend (which started at 1.3044 and reached a low of 1.2664) might be over.
- Next Target: If we see this breakout, the next level to watch is 1.2839. This could be the target for bulls in the short to medium term.
Potential Bearish Scenario However, if the resistance holds, we could see continued downward pressure. Here are the key levels to monitor:
- Initial Support: Keep an eye on 1.2710. A drop below this level could trigger further selling.
- Critical Support: The recent low of 1.2664 is crucial. If this level breaks, it could open the door for a move towards 1.2600.
Key Takeaways for Traders
- Watch the Trend Line: The falling trend line on the 4-hour chart is the most important level right now. A break above or a bounce off this line could determine the next major move.
- Key Levels to Monitor:
- Upside Target: 1.2839 (if bullish breakout occurs)
- Initial Support: 1.2710
- Critical Support: 1.2664
- Downside Target: 1.2600 (if bearish scenario unfolds)
- Be Prepared for Both Scenarios: While the trend has been downward, a breakout is always possible. Have a plan for either direction.
Remember, forex markets can change quickly. Always use proper risk management techniques and stay informed about economic events that could impact currency movements.
We’ll continue to monitor GBP/USD and provide updates as the situation evolves. Happy trading!