The NAS100 index has witnessed a notable bounce, extending from the 16973 level to as high as 18170. However, this upward move is likely a corrective phase within the broader downtrend that commenced from the 18488 high. After this corrective rally, another decline in the NAS100 could potentially be on the horizon.
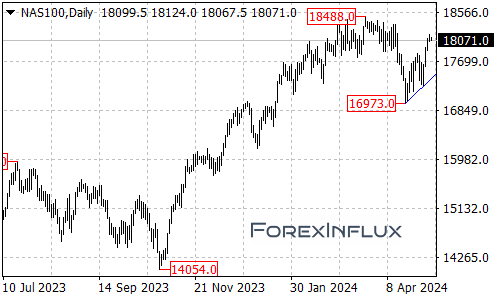
On the downside, the initial support for the NAS100 is situated at the 17870 level. A breakdown below this level could potentially lead the index back towards the rising trend line on the daily chart. If the NAS100 breaches this trend line support, it could trigger further downside momentum, potentially leading to a retest of the 16973 support level.
Should the selling pressure persist and the NAS100 break below the 16973 support, the focus would shift towards the 16500 area, which could act as a significant target for the bears.
However, it’s important to note that the NAS100 could also potentially witness a bullish reversal. If the index manages to break above the 18488 previous high resistance, it could signal a resumption of the long-term uptrend that commenced from the October 2022 low of 10437.
In such a scenario, the next target for the bulls would be the 19200 area, potentially marking the start of a broader uptrend.
In summary, the NAS100 is currently navigating a corrective bounce from the 16973 level, with the potential for further downside after this correction. Traders should closely monitor the 17870 support level, the rising trend line on the daily chart, and the 16973 and 16500 levels for potential bearish signals.
On the bullish side, a break above the 18488 resistance could potentially signal a resumption of the long-term uptrend, with the 19200 area acting as the next target for the bulls.
Traders and investors are advised to remain vigilant and adapt their strategies based on the evolving price action in the NAS100 index.