The British Pound to US Dollar exchange rate (GBP/USD) has been on a downward trend recently. Let’s break down what’s happening and what traders should watch for in the coming days.
Recent Price Action
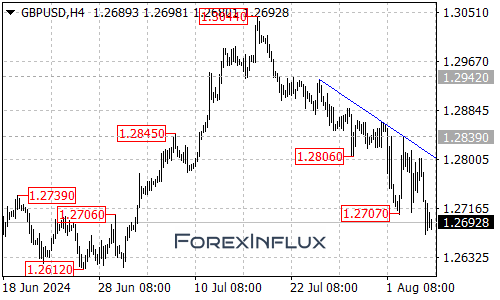
- GBP/USD has dropped from a high of 1.3044 to a low of 1.2672.
- This significant move has caught the attention of forex traders worldwide.
Technical Analysis: What the Charts Tell Us Looking at the 4-hour chart, we can see a clear falling trend line. This line is crucial for understanding the pair’s potential next moves.
Bearish Scenario: Further Downside Possible
- As long as GBP/USD stays below the falling trend line, we could see more downward movement.
- The next target for bears could be around 1.2640.
Key Levels to Watch
- Resistance: 1.2750
- This is the first hurdle for any potential recovery.
- A move above this level could signal a short-term bounce.
- Trend Line Resistance
- The falling trend line on the 4-hour chart is the most significant resistance.
- Breaking above this line would be a strong signal that the downtrend might be over.
What Traders Should Look For
- Continued Weakness: If GBP/USD remains below the trend line, look for potential shorting opportunities with a target near 1.2640.
- Potential Reversal Signs:
- Watch for a break above 1.2750. This could lead to a test of the falling trend line.
- A decisive break above the trend line could indicate that the downtrend is ending.
Key Takeaways
- The overall trend for GBP/USD is currently downward.
- 1.2640 is the next potential target if the weakness continues.
- Keep a close eye on how the pair behaves around 1.2750 and the falling trend line for any signs of a reversal.
Remember, forex markets can change quickly. Always use proper risk management and stay informed about economic events that could impact currency movements.
We’ll continue to monitor GBP/USD and provide updates as the situation evolves. Happy trading!