The US Dollar/Japanese Yen (USDJPY) pair has been showing some interesting patterns lately. Let’s break down the current situation and potential scenarios based on the 4-hour chart analysis.
Current Trend
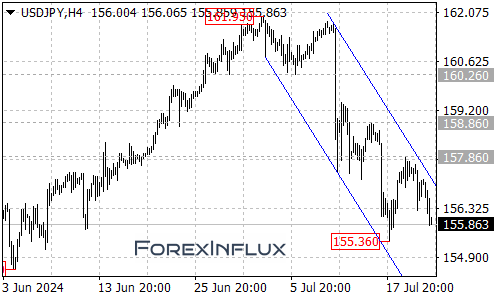
- USDJPY is currently moving within a falling price channel on the 4-hour chart.
- This suggests that the pair is maintaining its downtrend from the recent high of 161.95.
Bearish Scenario
As long as the price remains within the channel:
- The downward movement is expected to continue.
- If the price breaks below the 155.63 support level, we could see further downside movement.
- Potential target levels in this scenario:
- First target: 154.50
- Next target: 153.90 area
Bullish Scenario
For a bullish reversal, we’d need to see:
- A breakout above the channel’s resistance line.
- If this occurs, the next resistance level to watch is 157.86.
- A break above 157.86 could push the price towards 158.86.
Key Levels to Watch
Support Levels
- Critical support: 155.63
- Next support: 154.50
- Further support: 153.90 area
Resistance Levels
- Channel resistance (variable, check the chart)
- Next resistance: 157.86
- Further resistance: 158.86
Conclusion
The USDJPY pair is currently in a downtrend, moving within a falling price channel. Traders should keep a close eye on the channel boundaries and the key support/resistance levels mentioned. A break below support could accelerate the downtrend, while a break above the channel resistance might signal a potential reversal.
Remember, always use proper risk management techniques and stay informed about broader market conditions that could impact currency movements.