Forex trading, or foreign exchange trading, is the act of buying and selling currencies with the aim of making a profit from the changes in their value. As the world’s largest financial market, Forex operates around the clock, facilitating the exchange of trillions of dollars worth of currencies daily. The fluctuation in currency values is influenced by a myriad of factors, including economic indicators, political events, and market sentiment, making the ability to predict price movements crucial for traders.
Technical analysis (TA) tools are indispensable for traders, providing a framework to interpret market trends and forecast potential price movements. Among these tools, chart patterns stand out as a powerful method for visualizing and analyzing price action. By recognizing common patterns, traders can discern the underlying market sentiments and make informed decisions.
This article aims to empower traders by elucidating the intricacies of chart pattern analysis in Forex trading. Through this lens, we will explore how identifying and understanding these patterns can enhance trading strategies and decision-making processes. We will delve into the various types of chart patterns, such as head and shoulders, triangles, and flags, examining their unique characteristics and the trading signals they may offer.
By the end of this article, readers will have a comprehensive understanding of how chart pattern analysis can be a game-changer in their trading toolkit. We will provide practical insights into applying these patterns within the context of a broader trading strategy, ultimately striving to improve the reader’s proficiency in navigating the Forex market.
Understanding Chart Patterns
Chart patterns are distinctive formations created by the movements of security prices on a chart and are a cornerstone of technical analysis. These patterns represent the psychological give-and-take between buyers and sellers in the market, which manifests as patterns that signal future price movements. There are two primary categories of chart patterns: continuation and reversal. Continuation patterns, such as triangles, flags, and pennants, suggest that the market is taking a breather before continuing an existing trend. On the other hand, reversal patterns, like head and shoulders or double tops and bottoms, indicate that the current trend may be about to turn the other way. Proper identification and confirmation of these patterns through additional indicators and volume analysis are crucial to avoid false signals and to enhance the reliability of predictions based on these patterns. Understanding and utilizing chart patterns can be a powerful tool for traders looking to gauge market sentiment and make informed decisions.
Common Continuation Patterns
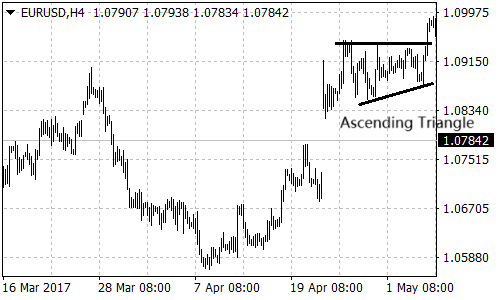
In technical analysis, common continuation patterns indicate that a trend is likely to continue after a brief pause. The Ascending Triangle is characterized by a flat upper trendline that acts as resistance and an ascending lower trendline that serves as support. Traders anticipate a potential breakout above the resistance, signaling the continuation of an uptrend. Conversely, the Descending Triangle has a flat lower trendline as support and a descending upper trendline as resistance. A breakout below the support level suggests a continuation of the existing downtrend.
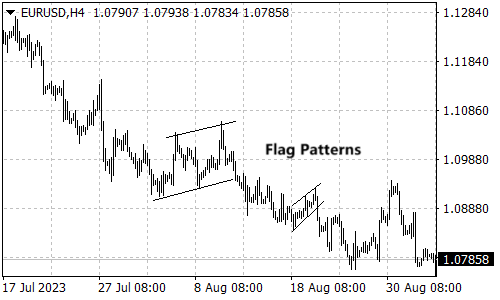
Flags and Pennants are short-term patterns that appear small and narrow, with price movements contained within two parallel trendlines. They represent a consolidation phase within a larger trend. A breakout from the pattern in the direction of the prevailing trend is considered a confirmation of trend continuation.
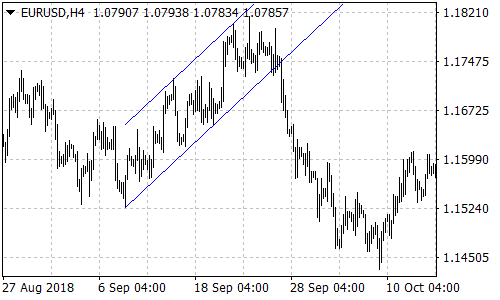
The Rectangle or Channel pattern is formed when the price moves between parallel support and resistance levels, indicating a consolidation phase. A breakout above the resistance level suggests bulls have gained control and the uptrend will likely resume. Similarly, a breakout below the support level indicates that bears are in control, suggesting a continuation of the downtrend. These patterns are valuable tools for traders, providing insights into market sentiment and potential price movements.
Common Reversal Patterns
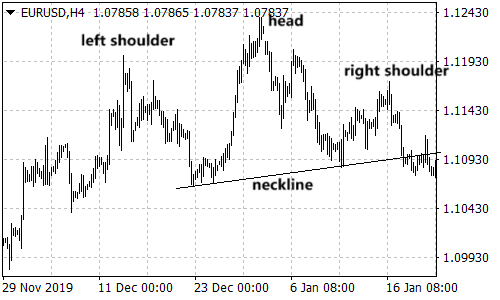
The Head and Shoulders (H&S) pattern is a chart formation that predicts a bullish-to-bearish trend reversal. It is characterized by a peak (head) followed by two lower peaks (shoulders) and a neckline connecting the lowest points of the two troughs. The pattern is confirmed when the price falls below the neckline after forming the second shoulder. Conversely, the Inverse Head and Shoulders pattern indicates a bearish-to-bullish reversal, with the confirmation coming from a price rise above the neckline.
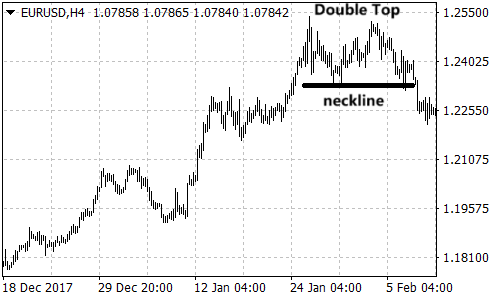
The Double Top and Double Bottom patterns are also indicative of potential trend reversals. A Double Top, resembling the letter ‘M’, occurs after a prolonged uptrend and suggests a shift to a downtrend upon the price falling below the support level between the two tops. The Double Bottom, appearing as a ‘W’, signals a possible change from a downtrend to an uptrend, confirmed when the price rises above the resistance level between the two bottoms.
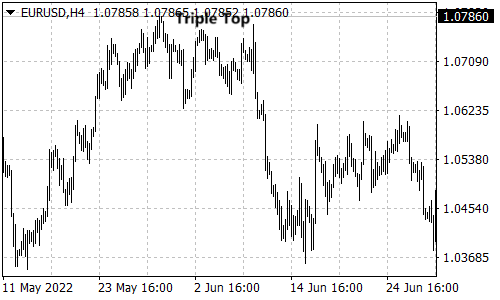
Lastly, the Triple Top and Triple Bottom patterns are similar to their double counterparts but include an additional peak or trough. These patterns are considered stronger signals due to their rarity and suggest a more significant reversal when the price breaks through the corresponding support or resistance level.
Combining Chart Patterns with Other Tools
While chart patterns are a valuable component of technical analysis, relying solely on them may not provide the most accurate trading decisions. It’s beneficial to use chart patterns in conjunction with other technical analysis tools to increase the probability of success. Technical indicators such as the Relative Strength Index (RSI) and the Stochastic Oscillator can offer additional confirmation of trends and potential breakouts. The RSI measures the magnitude of recent price changes to evaluate overbought or oversold conditions, while the Stochastic Oscillator compares a particular closing price of an asset to a range of its prices over a certain period. Additionally, understanding support and resistance levels can significantly strengthen the signals provided by chart patterns. Support levels indicate a price level where an asset may find difficulty falling below, suggesting a pause or reversal of a downtrend. Conversely, resistance levels are where prices might struggle to rise above, indicating a pause or reversal in an uptrend. Combining these tools with chart patterns can provide a more robust framework for making informed trading decisions.
Risk Management and Conclusion
Risk management is a critical component of Forex trading, providing a safety net against the unpredictable movements of the market. Strategies such as stop-loss orders are essential, as they can help traders limit potential losses by automatically selling a position at a predetermined price. This proactive approach to risk mitigation is indispensable in preserving capital. Furthermore, chart pattern analysis remains a valuable tool for traders, offering insights into market trends and potential turning points. By understanding and interpreting these patterns, traders can make more informed decisions, enhancing their ability to capitalize on market movements. Lastly, the pursuit of knowledge in technical analysis and adherence to responsible trading practices cannot be overstated. Continuous learning and disciplined trading are the hallmarks of a successful Forex trader, paving the way for long-term profitability and risk-adjusted returns. It is through the diligent application of these principles that traders can navigate the complexities of the Forex market with greater confidence and control.