Technical analysis is a cornerstone of trading and investing, and understanding support and resistance levels is fundamental to this practice. These levels help traders predict where prices might pause or reverse direction, which can significantly enhance trading strategies. Support and resistance levels are derived from analyzing historical price patterns and are influenced by the dynamics of supply and demand within the market.
Determining Support and Resistance Levels
Support and resistance levels can be identified using various methods, each offering unique insights into market behavior.
Peaks and Troughs
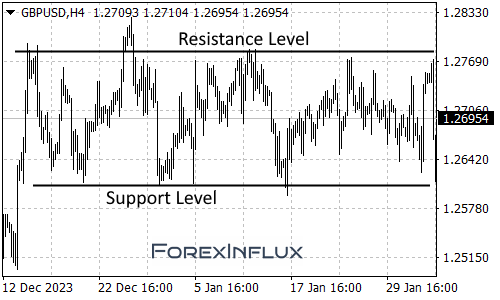
One of the most straightforward methods to identify support and resistance levels is by examining peaks (high points) and troughs (low points) on a price chart. These points represent historical levels where the price has reversed direction. For instance:
- Support Level: A trough or low point where the price has previously rebounded upwards.
- Resistance Level: A peak or high point where the price has previously fallen downwards.
By marking these peaks and troughs, traders can identify potential areas where the price might react similarly in the future.
Previous Timeframes
Another effective approach is to analyze support and resistance levels from previous timeframes. This involves:
- Drawing support and resistance lines on shorter timeframe charts (e.g., 15-minute charts).
- Identifying levels that consistently hold across different timeframes.
This method helps traders understand the strength of these levels. For example, a support level on a 15-minute chart that aligns with a support level on a daily chart is likely to be a strong support level.
Moving Averages and Trend Lines
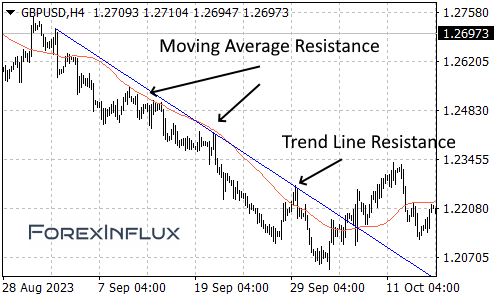
Moving averages and trend lines offer dynamic ways to determine support and resistance levels. Unlike static peaks and troughs, these tools adjust as the chart progresses, providing a more fluid understanding of where price might encounter obstacles.
- Moving Averages: These are average prices over a specified period and can act as support or resistance levels. For instance, the 50-day moving average often serves as a support level in an uptrend.
- Trend Lines: Drawing lines that connect successive highs or lows can help identify the direction and strength of a trend, serving as dynamic support or resistance.
Support and resistance levels can change over time
Support and resistance levels are indeed dynamic, often shifting due to external influences like news events or shifts in market sentiment. Rather than being static, these levels adjust to the market’s changing dynamics.
Characteristics of Support and Resistance Levels
Understanding the characteristics of support and resistance levels is crucial for interpreting price movements accurately.
Psychological Barriers
Support and resistance levels often act as psychological barriers for traders. For example, a round number like $100 for a stock might serve as a significant resistance level because many traders have placed sell orders at this price, anticipating a reversal. When the price approaches these levels, it triggers buying or selling actions, reinforcing the strength of the level.
Testing vs. Breaking Through
It’s essential to differentiate between testing and breaking through support and resistance levels:
- Testing: If a price touches or slightly breaks through a support or resistance level but then quickly reverses, it is considered a test. This action confirms the level’s validity.
- Breaking Through: If the price stays below a support level or above a resistance level for an extended period, it suggests that the level has been breached. This can indicate a continuation of the price movement in the direction of the breakout.
Flexibility and Zones
Support and resistance levels are not precise points but rather zones. Prices may occasionally dip below support levels or rise above resistance levels before reversing. Recognizing this flexibility is crucial for traders. For example:
- Support Zone: A range where the price finds buying interest.
- Resistance Zone: A range where the price faces selling pressure.
This understanding helps traders avoid premature decisions based on minor breaches.
Practical Application of Support and Resistance Levels
Identifying and using support and resistance levels can significantly enhance trading strategies by providing insights into potential entry and exit points. Here’s how traders can apply these concepts in practice:
Setting Stop-Loss Orders
Support and resistance levels are valuable for setting stop-loss orders, which are critical for risk management. By placing stop-loss orders below support levels in long positions or above resistance levels in short positions, traders can limit potential losses if the market moves against them.
Targeting Profits
Traders can also use support and resistance levels to set profit targets. For instance, if a trader enters a long position at a support level, they might set a profit target near the next resistance level. This approach helps in systematically capturing profits.
Understanding Market Sentiment
Observing how the price interacts with support and resistance levels over time offers valuable clues about underlying market sentiment. For example:
- Strong Support Level: If a price repeatedly bounces off a support level, it indicates strong buying interest, suggesting bullish sentiment.
- Strong Resistance Level: Conversely, if a price fails to break through a resistance level, it indicates strong selling pressure, suggesting bearish sentiment.
Combining Methods for Greater Accuracy
While each method of identifying support and resistance levels has its strengths, combining them can provide a more comprehensive view. For example:
- Using peaks and troughs to identify static levels.
- Analyzing moving averages for dynamic levels.
- Cross-referencing these with levels from previous timeframes.
This multi-faceted approach enhances the accuracy of the identified levels and provides a clearer picture of potential price movements.
Conclusion
Support and resistance levels are critical components of technical analysis, offering traders a framework to anticipate price movements and make informed trading decisions. By understanding how to identify these levels through various methods and recognizing their characteristics, traders can better navigate the complexities of the financial markets. The practical application of these levels in setting stop-loss orders, targeting profits, and gauging market sentiment can significantly enhance trading strategies. Moreover, combining different methods for identifying support and resistance levels can lead to more accurate and reliable insights, ultimately improving trading outcomes.