Exponential Moving Averages (EMAs) are a cornerstone of technical analysis, offering traders and analysts a mathematical approach to smoothing price data over a specified period. Unlike simple moving averages, EMAs give more weight to recent prices, which can provide a more responsive indicator of market direction. This responsiveness to recent price changes helps traders discern the underlying trend in a security’s price, reducing the impact of random price fluctuations, or ‘noise’, that can mislead interpretation. EMAs are particularly useful in identifying potential support and resistance levels, which can be instrumental in making informed trading decisions. They also serve as a tool for gauging the strength and direction of a trend, allowing traders to align their strategies with the market’s momentum.
However, it’s important to acknowledge the inherent limitations of EMAs. Being a lagging indicator, an EMA can only provide insights based on past price data, which means it may not always predict future movements accurately. Additionally, while EMAs can be a valuable component of a trading strategy, they should not be relied upon as a standalone trading signal. Market conditions are complex, and indicators like EMAs must be used in conjunction with other analysis methods to validate trading signals and strategies. By understanding both the strengths and limitations of EMAs, traders can better navigate the markets and make more strategic trading decisions.
The Basics of Exponential Moving Averages (EMAs)
Moving averages (MAs) are fundamental tools used in technical analysis to smooth out price data by creating a constantly updated average price. The basic idea is to mitigate the random fluctuations that can occur in financial markets. An MA is calculated by adding up the closing prices of an asset over a certain number of periods and then dividing by that number of periods.
Exponential Moving Averages (EMAs), on the other hand, are a type of MA that gives more significance to the most recent prices, hence the term ‘exponential.’ This is achieved by applying more weight to recent data points, making EMAs more responsive to new information. The weighting applied to the most recent price depends on the selected period of the EMA. For instance, a 20-period EMA will give more weight to the prices in the most recent 20 periods than a 50-period EMA would.
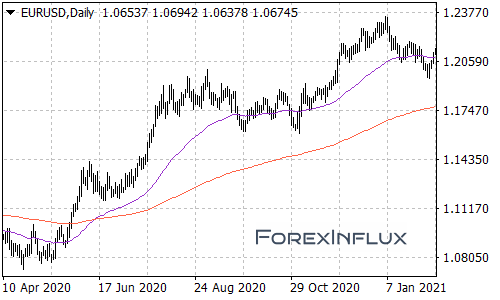
There are various types of EMAs, each defined by its period. A 20-period EMA will react more quickly to price changes than a 50-period EMA because it considers a shorter span of time and thus gives more weight to recent movements. Conversely, a 50-period EMA smooths out price data over a longer period, which can provide a clearer signal of the underlying trend but may lag more in response to recent price changes.
Calculating an EMA can be done using a simple formula or through charting tools available on most trading platforms. The formula for an EMA is ( (Value Today x ( Smoothing / ( 1 + Days ) ) ) + ( EMA Yesterday x ( 1 – (Smoothing / (1 + Days) ) ) ) ), where the smoothing factor is typically set to 2.
For example, to calculate a 10-day EMA: if the EMA yesterday was $50, and the price today closes at $52, the smoothing factor would be ( 2 / ( 1 + 10 ) = 0.1818 ). The EMA for today would be ( ( 52 x 0.1818 ) + ( 50 x ( 1 – 0.1818 ) ) ) = 9.454 + 40.91 = 50.364. This value would then be the new EMA that would be used in the next calculation.
EMAs are particularly useful in identifying trends and potential reversals, as well as providing support and resistance levels in the market. However, it’s important to note that no indicator should be used in isolation, and EMAs are best used in conjunction with other forms of analysis and indicators.
Interpreting EMA Signals
Identifying Trends
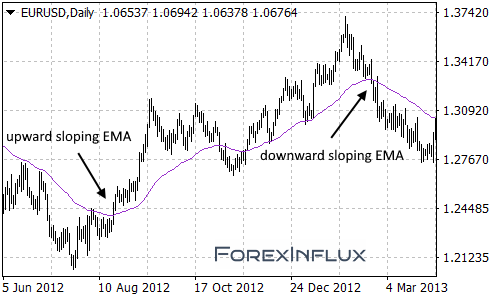
Interpreting Exponential Moving Average (EMA) signals is a critical aspect of technical analysis in trading, providing insights into market trends and potential reversals. An upward sloping EMA typically suggests an uptrend, indicating that the price is moving above the EMA, which may be interpreted as a bullish signal. Conversely, a downward sloping EMA is indicative of a downtrend, with the price moving below the EMA, often considered a bearish signal. The steepness of the EMA slope can be analyzed to gauge the strength of the trend; a steeper slope may imply a stronger trend.
Crossovers
Crossovers are pivotal points in EMA analysis. A multiple EMA crossover strategy, such as a 50-period EMA crossing above a 200-period EMA, is commonly used to identify potential trend changes. The location of the crossover, whether it occurs above or below key support or resistance levels, along with confirmation from subsequent price movement, can provide a more robust signal.
Support and Resistance
Support and resistance levels are also discernible through EMA analysis. A flattening or horizontal EMA may signal potential support or resistance zones. It is essential to analyze the price action around the EMA to confirm its validity as a support or resistance level. Such confirmation could come from price bounces off the EMA or price breaking through the EMA with significant volume.
Advanced EMA Techniques
Multiple EMA Crossover Strategies
In the realm of technical analysis, the Exponential Moving Average (EMA) stands as a pivotal tool, particularly when multiple EMAs with varying timeframes are employed in tandem. This technique, known as Multiple EMA Crossover Strategy, involves utilizing short-term, mid-term, and long-term EMAs to discern trend confirmations and potential reversals. For instance, a trader might use a combination of 10-day, 20-day, and 50-day EMAs. A crossover strategy could be exemplified when the short-term EMA (10-day) crosses above the mid-term (20-day) and long-term (50-day) EMAs, suggesting a bullish trend confirmation. Conversely, if the short-term EMA descends below the longer EMAs, it may signal a potential bearish reversal.
Dynamic EMAs
Dynamic EMAs add another layer of sophistication to market analysis. This approach entails adjusting the EMA periods dynamically in response to market volatility. When volatility is high, shorter periods may be used to be more responsive to price changes, whereas longer periods could be favored during times of low volatility to filter out market noise. The benefits of dynamic EMAs include increased adaptability and potentially more timely signals for entering or exiting trades. However, the drawbacks must also be considered, such as the increased complexity and the risk of overfitting to historical data, which may not accurately predict future market movements.
Double Exponential Moving Averages (DEMA)
Double Exponential Moving Averages (DEMA) are a refinement of the traditional Exponential Moving Averages (EMA), designed to reduce lag and provide a more responsive tracking of price trends. The DEMA is calculated by taking an EMA of the price, then creating a second EMA of the first EMA, and finally combining these two EMAs in a specific manner to eliminate lag. The formula for DEMA is ( DEMA = 2 x EMA_N – EMA(EMA_N) ), where ( N ) is the look-back period. This makes DEMA quicker to react to price changes, potentially providing traders with earlier signals for trend changes compared to EMA.
Triple Exponential Moving Averages (TEMA)
The Triple Exponential Moving Average (TEMA) takes this concept further by applying a triple smoothing of price data. It aims to filter out market noise even more effectively than DEMA, which can be particularly useful in choppy market conditions. TEMA is calculated by taking an EMA of the price, then an EMA of that EMA, and then an EMA of the second EMA, thus the ‘triple’ in its name. The formula for TEMA is ( TEMA = 3 x EMA_1 – 3 x EMA_2 + EMA_3 ), where ( EMA_1 ) is the first EMA, ( EMA_2 ) is the EMA of ( EMA_1 ), and ( EMA_3 ) is the EMA of ( EMA_2 ). This indicator can provide traders with a more precise and timely understanding of the trend direction, potentially leading to more effective trading strategies.
Adaptive Moving Average (AMA)
The Adaptive Moving Average (AMA), also known as Kaufman’s Adaptive Moving Average (KAMA), is designed to adapt to market volatility. Unlike DEMA and TEMA, which are fixed in their look-back periods, AMA adjusts its sensitivity based on how volatile the market is. When the market is more volatile, AMA becomes less sensitive to price changes, reducing the likelihood of false signals. Conversely, in a less volatile market, AMA becomes more sensitive, closely tracking price movements. This dynamic adjustment makes AMA a versatile tool for traders who need to account for changing market conditions. AMA’s ability to adjust to the market’s volatility can help traders minimize the lag in their indicators and improve the timing of their trades.
Moving Average Convergence Divergence (MACD) Indicator
The Moving Average Convergence Divergence (MACD) indicator is another tool that leverages EMAs. It is constructed using two EMAs and helps traders identify trend strength and potential turning points through the difference between these EMAs. The MACD line is the difference between a short-term EMA and a long-term EMA, and when it crosses the signal line, it can indicate a potential trend change. The MACD histogram, which plots the distance between the MACD line and its signal line, can also provide insights into the momentum behind a price move.
Combining EMAs with Other Indicators
Integrating EMAs with other technical indicators can enhance the robustness of market analysis. For example, the Moving Average Convergence Divergence (MACD) and the Relative Strength Index (RSI) are commonly combined with EMAs. The MACD, which includes elements of multiple EMAs in its calculation, can confirm the strength and direction of a trend signaled by an EMA crossover. Meanwhile, the RSI can provide insights into the momentum and possible overbought or oversold conditions, complementing the trend information gleaned from EMAs. By amalgamating EMAs with these indicators, traders can obtain a more comprehensive view of the market, potentially leading to more informed and strategic trading decisions. Combining these tools requires careful analysis and a nuanced understanding of how they can interact to provide actionable insights.
Using EMAs Effectively in Trading
Exponential Moving Averages (EMAs) are a vital tool in trading, providing dynamic support and resistance levels that adapt to price action. However, it’s crucial to understand that EMAs are not infallible signals on their own. They must be used in conjunction with other indicators and market analysis methods to confirm potential trends. Market sentiment, which reflects the overall attitude of investors towards a particular security or financial market, is an essential factor to consider alongside EMAs. It provides context to the price movements that EMAs track.
Furthermore, fundamental analysis, which involves evaluating a company’s financial statements and health, industry conditions, and the broader economy, can offer insights that EMAs alone cannot. This analysis helps traders understand the ‘why’ behind price movements, allowing for more informed decision-making. Backtesting is another critical practice, enabling traders to assess the effectiveness of an EMA-based strategy by applying it to historical data. This process helps identify the strengths and weaknesses of the strategy, and how it might perform under various market conditions.
Lastly, incorporating EMAs into a comprehensive risk management strategy is paramount. This involves setting stop-loss orders to minimize potential losses, determining the size of positions to avoid overexposure, and diversifying investments to reduce risk. By using EMAs as part of a broader, disciplined trading approach, traders can enhance their ability to navigate the markets and make more strategic decisions. Remember, no single tool or method guarantees success in trading; it’s the combination of tools, sound analysis, and risk management that creates a robust trading plan.
Conclusion
Exponential Moving Averages (EMAs) are a fundamental tool in technical analysis, providing dynamic support and resistance levels that adapt to price action more responsively than their Simple Moving Average counterparts. By prioritizing recent price data, EMAs offer traders a closer reflection of current market sentiment. The versatility of EMAs allows for a range of applications, from the identification of short-term trends with shorter periods to the observation of long-term market direction with longer periods. However, it’s crucial to acknowledge the limitations of EMAs, such as the potential for false signals during sideways or choppy market conditions and their lagging nature, which inherently relies on past data. Despite these limitations, EMAs remain a valuable instrument for traders, offering insights into potential entry and exit points and helping to discern the strength of market trends. As with any trading tool, the effective use of EMAs requires a comprehensive understanding of their mechanics and should be complemented with other analysis methods to confirm signals. Traders are encouraged to continue their education in technical analysis, integrating EMAs with a broader strategy and adhering to disciplined trading practices to navigate the markets responsibly.