The GBPUSD currency pair has taken a bullish technical turn by breaking above the falling trendline resistance visible on the 4-hour chart timeframe. This development suggests that a corrective rebound within the broader downtrend from the 1.2892 peak could now be underway.
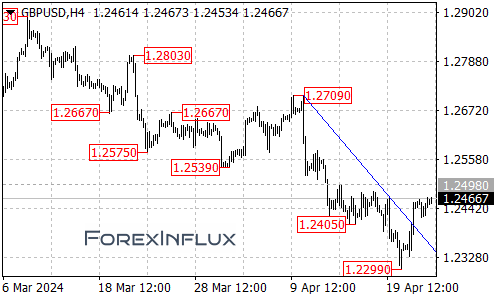
With the pair clearing this key resistance hurdle, further GBPUSD gains are likely to be seen over the coming days. The first major upside target in sight is the 1.2498 resistance area. A push through 1.2498 would open the path for an extension toward the 1.2570 zone, followed by potential resistance around 1.2630.
In the near-term, the first meaningful support for GBPUSD has arrived at the 1.2385 level. As long as the currency pair holds above this area, the near-term technical bias will remain tilted in favor of the bulls targeting further upside within the corrective recovery.
However, a breakdown below 1.2385 support could see GBPUSD revisiting a retest of the 1.2299 level next. A plunge through 1.2299 would mark an even more significant bearish development, potentially exposing the 1.2200 handle as the next key downside target.
For now, the trendline break has shifted the spotlight higher, with the 1.2498, 1.2570, and 1.2630 resistance levels representing the key upside objectives for any continuation of the newly-emerged corrective rebound. Barring a swift reversal back below 1.2385 and 1.2299 support, the path of least resistance appears to be a further recovery higher within the upside correction off the recent lows.
GBPUSD traders will want to keep a close eye on the noted support and resistance levels in the coming sessions. The ability (or inability) to push through areas like 1.2498 and 1.2570 will help determine whether the corrective upswing has legs or if sellers are awaiting to regain control. Meanwhile, a loss of the 1.2385 and 1.2299 support floors would raise doubts about the correction’s sustainability.