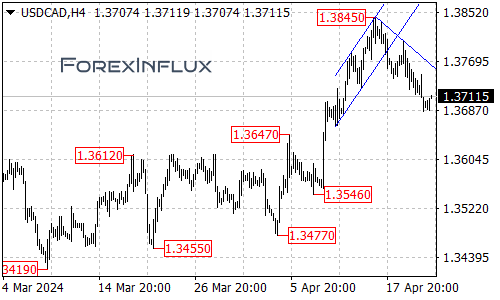
The USDCAD currency pair remains trading below a falling trendline visible on the 4-hour chart timeframe. This technical setup suggests that the broader downtrend from the 1.3845 high is still very much in force at the moment.

As long as USDCAD continues to respect that falling trendline resistance area, the path of least resistance appears to be for a continuation of the current bearish momentum. The next key targets that sellers will be eyeing on further downside are the 1.3650 handle, followed by the 1.3600 zone.
In the near-term, the first meaningful resistance for USDCAD arrives at the 1.3720 level. Only a break back above 1.3720 would open the door for a potential recovery move to challenge the falling trendline resistance next.
However, the overall downtrend scenario is expected to remain intact unless and until USDCAD can break and hold firmly above that trendline resistance area on the 4-hour chart. A decisive trendline break and flip of that resistance would be the first sign that the downtrend from 1.3845 may have potentially completed. In that scenario, the next key upside target to watch is a potential retest of the 1.3845 peak.
But for now, as long as USDCAD remains capped below the falling trendline resistance, the bias will remain tilted in favor of the sellers targeting further downside towards the 1.3650 and 1.3600 levels next.
USDCAD traders will want to keep a close eye on the price action around the 1.3720 resistance and falling trendline area in the coming sessions. The ability (or inability) to push through those levels will help determine whether the downtrend has further to run or if a bullish reversal could potentially be brewing.
The key levels to monitor are the falling trendline resistance for potential breakout signals and the 1.3650 and 1.3600 handles on the downside for sellers to maintain control. Only a flip of the trendline to new support would shift the outlook to more neutral or even bullish for a move back towards 1.3845 next.