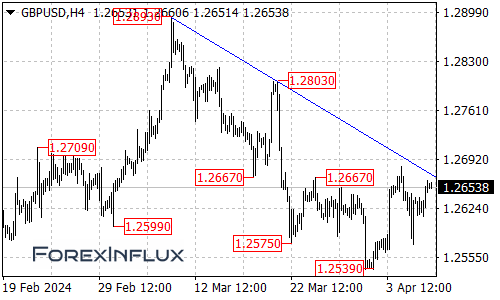
The GBPUSD currency pair is currently facing an important resistance level in the form of a falling trendline on the 4-hour chart time frame. This trendline has been capping rallies in the pair for several weeks now as part of the broader downtrend from the 1.2893 high.

The most recent bounce in GBPUSD off the 1.2539 low could simply be a temporary consolidation before the downtrend potentially resumes. As long as the pair remains below the falling trendline resistance, traders will be watching for a potential move down towards the 1.2400 handle.
In the near-term, the first key support level to watch is at 1.2610. A breakdown below 1.2610 would increase the bearish momentum and open the way for a continuation down to retest the 1.2539 low. Below 1.2539, the next major target on the downside is in the 1.2400 area.
However, if GBPUSD is able to break above the falling trendline resistance, it would be a signal that the downside move from the 1.2893 high may have completed already at the 1.2539 low. Such a break would turn the outlook bullish, with initial upside targets at the 1.2800 level followed by a potential retest of the 1.2893 previous high.
GBPUSD traders will want to keep a close eye on whether the pair can muster enough momentum to break the falling trendline resistance or if the sellers will regain control to push the downtrend from 1.2893 onwards towards 1.2400 next.