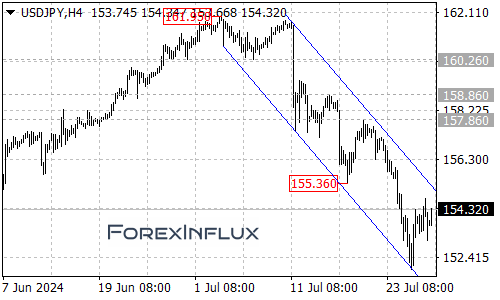
The USDJPY pair has recently shown signs of life, bouncing off the 151.93 level. This rebound is significant as it coincides with the bottom of the falling price channel visible on the 4-hour chart. What does this mean for traders? Let’s break it down.
Short-Term Outlook
In the coming days, we can expect to see further upward movement. The next target to watch is the top of the price channel. This consolidation phase suggests a temporary pause in the downtrend that began at 161.95.
Key Levels to Watch
Support Levels:
- 153.05 (Initial support)
- 151.93
- 150.90
- 150.00 area
Resistance Levels:
- Top of the price channel
- 155.80 (If channel resistance is broken)
Potential Scenarios
Bearish Scenario
If the price fails to break above the channel resistance, we could see a continuation of the downtrend. A breakdown below 153.05 might trigger another fall, potentially retesting the 151.93 support. If this level doesn’t hold, we could see further drops to 150.90 and possibly the psychologically important 150.00 area.
Bullish Scenario
On the flip side, a breakout above the channel resistance could be a game-changer. Such a move might push the price towards the next significant resistance at 155.80. A break above this level could signal the end of the current downtrend.
Conclusion
While the recent bounce suggests some short-term bullish momentum, it’s crucial to remember that the overall trend remains downward as long as the price stays within the falling channel. Traders should keep a close eye on the key levels mentioned and adjust their strategies accordingly.
Remember, always practice proper risk management and stay informed about economic events that could impact the USDJPY pair.